
Introduction
Ensuring that your systems operate smoothly is a top priority. AWS CloudWatch Alarms is a powerful tool that helps you monitor your resources and quickly respond when issues arise. This guide provides a clear explanation of CloudWatch Alarms, along with practical use cases that demonstrate how they can be beneficial.
What Are CloudWatch Alarms?
AWS CloudWatch Alarms are tools used to monitor metrics such as CPU usage, memory utilization, and network traffic. When predefined conditions are met, alarms trigger automated actions, such as sending notifications or scaling infrastructure.
Use Case:
- If an EC2 instance experiences high CPU utilization, a CloudWatch Alarm can trigger an automatic scale-up action to ensure availability.
- If available memory drops below a critical level, a notification can be sent to administrators to prevent system failure.
Key Features:
Monitor various metrics, including system health, application performance, and costs. Change states when specific thresholds are reached (OK, ALARM, INSUFFICIENT DATA). Automatically trigger actions, such as sending alerts or scaling resources. Combine multiple alarms into a single composite alarm to reduce noise.
How CloudWatch Alarms Work
CloudWatch Alarms function by continuously monitoring metrics and responding when specific conditions are met.
Metrics
Metrics are the fundamental data points monitored by CloudWatch. AWS provides default metrics, and users can also publish custom metrics.
Types of Metrics:
- Infrastructure Metrics: CPU utilization, disk I/O, network traffic (EC2, RDS, Lambda, etc.)
- Application Metrics: Error rates, response times (API Gateway, ECS, etc.)
- Custom Metrics: Business-specific KPIs (e.g., number of failed transactions)
- Thresholds
Thresholds define the conditions for triggering an alarm. For example, a CPU utilization alarm might activate when CPU usage exceeds 80%.
- Evaluation Periods
Evaluation periods determine how long a condition must persist before an alarm is triggered. If CPU utilization exceeds 80% for 5 consecutive minutes, the alarm will activate.
- Actions
- Actions define what happens when an alarm state changes. These include:
- Sending Notifications: Using SNS to notify administrators.
- Scaling Resources: Automatically increasing instance capacity.
- Executing Lambda Functions: Automating remediation actions.
Setting Up a CloudWatch Alarm
Quick Start Steps
Go to CloudWatch in AWS Console: Open the CloudWatch service in your AWS Management Console.

Create an Alarm:
Click create Alarm, select your metric, and set conditions:
Choose Metrics:
Navigate to the Metrics section.
Select Ec2 > Per-instance metrics.

Then, Select Metrics For example CPU Utilization.

Specify Metric and Condition and Click Next.
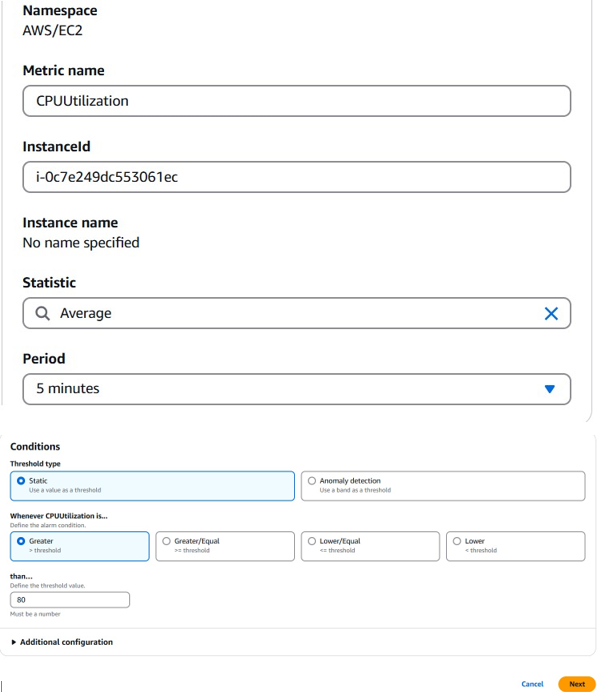
Example: Trigger an alarm when CPU usage is greater than 80% for 5 minutes.
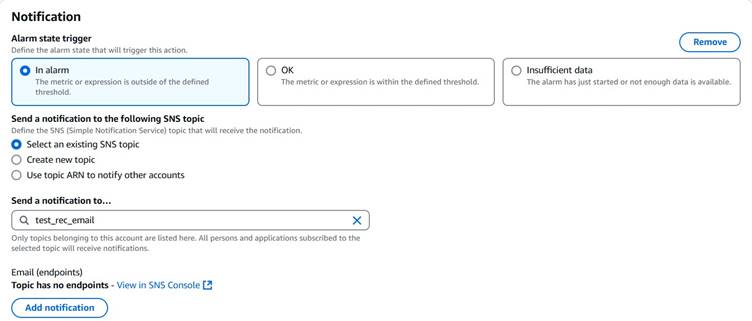
Set Actions:
Link to an SNS topic for notifications (e.g., send an email).
5.5 Review and Save:
Review your configurations and hit Create Alarm.
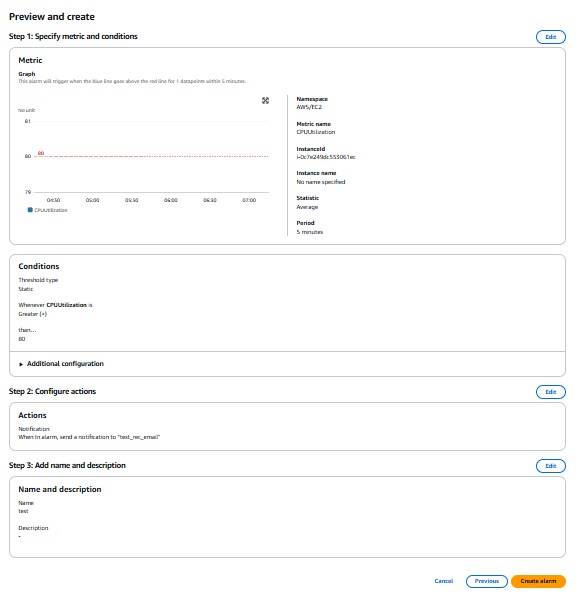
Example Use Case:
If an EC2 instance’s CPU usage consistently exceeds 80%, CloudWatch will send an email notification and trigger an Auto Scaling event.
Best Practices
Start Simple:
Begin with a few essential alarms (e.g., CPU utilization, disk space, memory usage) and gradually expand monitoring.
Example: Monitor only critical production servers before expanding to less critical ones.
Avoid Noise:
Use composite alarms to combine multiple alarms and prevent excessive alerts.
Example: Instead of setting separate alarms for high CPU, memory, and disk usage, use a composite alarm that triggers only if all conditions persist.
Use Anomaly Detection:
AWS provides anomaly detection to reduce the need for manually setting static thresholds.
Example: Instead of setting a fixed CPU threshold, let AWS detect abnormal patterns dynamically.
Automate Actions:
Configure alarms to automatically trigger AWS Lambda functions or scale EC2 instances.
Example: If CPU spikes, an Auto Scaling group automatically launches a new instance.
Monitor in Dashboards:
Use CloudWatch Dashboards to visualize multiple alarms and metrics together for better situational awareness.
Troubleshooting Tips
Alarm Stuck in INSUFFICIENT_DATA:
- Check if the metric is being reported frequently.
- Verify there’s no data publishing delay.
Frequent False Alarms:
- Adjust evaluation periods to reduce noise.
- Enable anomaly detection for dynamic thresholds.
No Notifications:
Ensure the SNS topic is correctly configured.
Check email spam folders for missed alerts.
Conclusion
AWS CloudWatch Alarms empowers you to proactively monitor your resources, respond swiftly to anomalies, and maintain the reliability of your infrastructure. By setting up real-time monitoring and alerts, you’re not just preventing downtime; you’re building a foundation for seamless operations and peace of mind.
Remember, the key to effective monitoring lies in starting simple, avoiding alert fatigue, and leveraging automation to handle repetitive tasks. Whether you’re scaling resources dynamically or receiving timely notifications, CloudWatch Alarms puts you in control. As you implement these practices, you’ll find that monitoring isn’t just about solving problems, it’s about creating a resilient, efficient, and future-ready environment. So, take the first step today. Set up your CloudWatch Alarms, fine-tune your thresholds, and let AWS do the heavy lifting. Your systems and your team will thank you. After all, in the world of cloud computing, being proactive isn’t just an option; it’s the smartest way forward. Happy monitoring!