
Understanding the disparities between logs and events is crucial when it comes to unraveling the mysteries of observability.
These two types of telemetry data serve distinct purposes in exploring your applications and comprehending user interactions.
In simple terms, logs aid in troubleshooting and root cause analysis, while events offer deeper insights into application performance through product analytics.
In this post, we will delve into the definitions of application telemetry data, shed light on the key disparities between logs and events, and explore their respective use cases.
Equipping yourself with knowledge about these telemetry data types will empower you to employ them more effectively in your observability strategy.
the Four Pillars of Telemetry Data
When it comes to observability, there are different interpretations of the pillars that form its foundation. Some propose the Logs-Metrics-Traces trio, while others expand it to Metrics-Events-Logs-Traces (MELT) with the inclusion of events as a distinct data type.
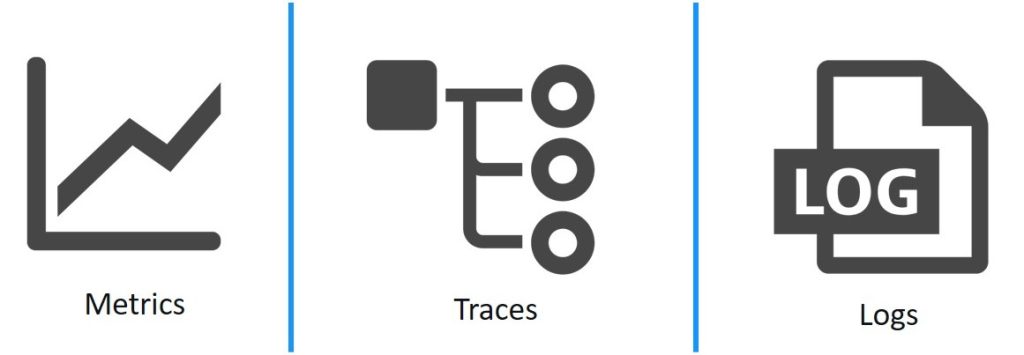
By considering these four types of telemetry data together, DevOps teams can gain comprehensive insights into the workings of their applications and infrastructure, enabling them to make informed decisions to enhance their products.
Metrics
Metrics are measurements characterized by the following attributes:
- Name
- Timestamp
- One or more numeric values
Events
Event telemetry involves discrete actions that occur at specific moments in time. Events can be likened to a historical record of system activities, facilitating analysis of user behaviors and more.
Logs
Logs, the original data type, consist of lines of text generated by a system during the execution of specific code. Logs can be either structured or unstructured, but using structured logs in formats like JSON or XML simplifies querying for troubleshooting or root cause analysis.
Traces
Also known as distributed traces, traces provide samples of causal chains of events or transactions between various components in a microservices ecosystem.
Differentiating Events from Logs
Many people mistakenly conflate events with structured logs. While it is true that all events can be represented as structured logs, the reverse is not always the case.
Events, unlike logs, encapsulate a unit of work and contain comprehensive information about the actions performed by a service. Logs, on the other hand, typically represent fragments or portions of events. Consequently, multiple logs can compose a single event.
Stay with me…
Think of events as a subset of logs that teams often analyze with greater granularity to understand user interactions with their applications. Query statistics within events provide valuable insights such as latency, segments, latency per step, user-specific actions, and more. Each of these query stats can be represented as a numerical field. By aggregating this data, DevOps teams can gain a profound understanding of application performance and user behaviors.
Use Cases: Leveraging Event Analytics and Log Analytics:
Now that we have defined these two data types, it is important to explore their respective use cases and why they differ.
At a fundamental level, log analytics primarily serve troubleshooting purposes, while events are instrumental in obtaining insights into products and user behaviors.
For instance, query stats can reveal information about the latency of each query in your system for individual users, offering insights into customer satisfaction with the product’s performance.
By extending the retention of telemetry data, organizations can analyze trends and monitor usage patterns over time.
While event analytics may seem intuitive, it poses challenges in cloud-native environments. Retention plays a critical role in event analytics, yet many observability systems restrict data retention windows to 30 days or less. This limitation makes it arduous to identify long-term trends, such as changes in product usage over time. Furthermore, effective product analytics necessitate near real-time access to data.
The ultimate objective is to empower DevOps teams to elevate operational telemetry to business-level insights, a critical aspect for software-powered companies. Here are a couple of examples:
- A gaming company utilizes telemetry data for game balancing. By analyzing the items players were using, as well as their actions before and after death, the DevOps team can identify overpowered or underpowered characters.
- A fintech company adopts event analytics to comprehend application- and transaction-related events. By recording events issued by Lambdas, the DevOps team can determine the number of transactions per merchant and the volume of orders across merchants for customers.
Conclusion | Logs and Events
Distinguishing between logs and events is essential for effective observability. While logs aid in troubleshooting and root cause analysis, events offer insights into user interactions and product performance. By harnessing the power of these telemetry data types, DevOps teams can make informed decisions and improve their applications.
With SUDO Consultants scalable and cost-effective solutions, organizations can unlock the full potential of their telemetry data, enabling comprehensive analytics and elevating operational telemetry to business-level insights – Premier AWS Partner in the UAE