
How to monitor DataBricks with Amazon CloudWatch
Importance of Monitoring Systems
Software engineers often forget the importance of monitoring systems that run their infrastructure. When things go wrong, they do not have the tools to detect and react to issues fast enough. This can be dangerous because it may take them hours or even days to notice and correct the problem. And during those hours or days, the service may be unavailable. So they can lose a lot of business. You can read more on how to monitor applications with AWS effectively.
DataBricks Lakehouse
The Databricks Lakehouse platform offers users a way to manage their data in one place – on-premises or on the cloud – while enabling organizations to use AI, ML, and IoT solutions from the same platform.
You don’t need to build a new architecture or software when you have data in the lake. You get full access to the data – whether it resides in the cloud or on-premise. Your users can easily access and share data using the tools and APIs they already know. And the platform is designed so that users can evolve quickly, with minimal effort and time commitment, while avoiding the risk of investing time and money in building a separate data warehouse.
AWS CloudWatch
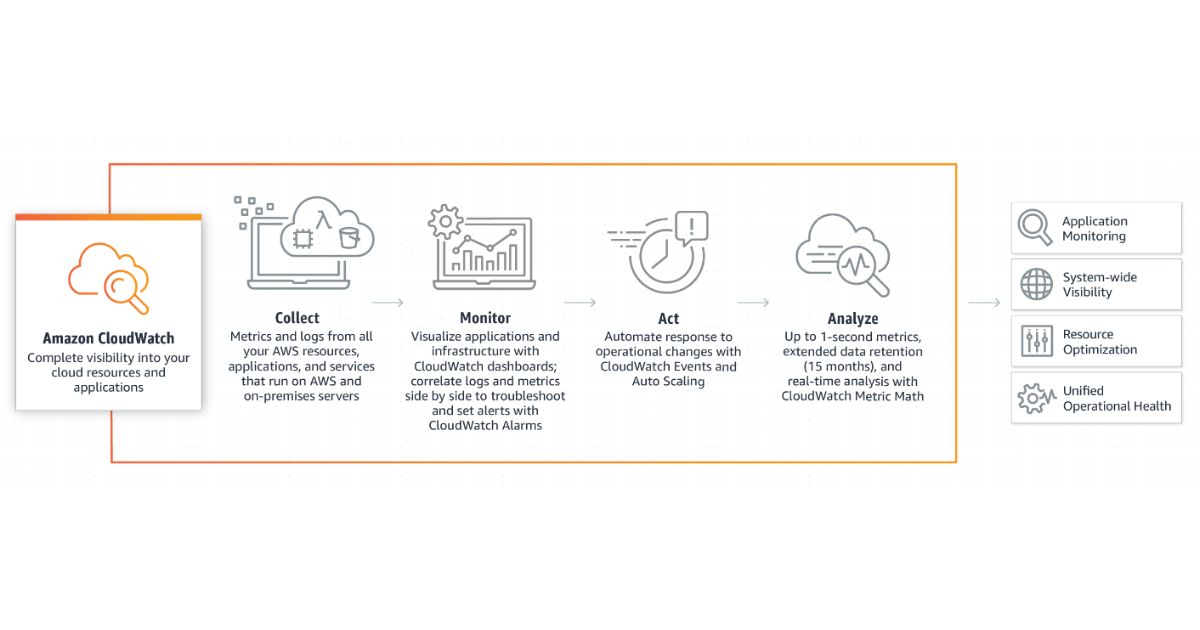
An AWS account allows you to use the resources of the cloud, including the elasticity, security, availability, and scalability of your applications. Amazon CloudWatch is a part of the AWS family that assists in monitoring, alerting, and collecting analytics for our AWS environments.
The solution offered by Amazon will help you keep track of everything you use on the cloud. This includes both resources and services. It will tell you whether those resources and services are currently working and if any issues need to be addressed. Also, you can check the troubleshooting practices regarding CloudWatch.
Although this isn’t a novel idea, AWS with Amazon CloudWatch will provide benefits to you. So let’s look at steps for integrating Databricks with AWS CloudWatch, which will further top you run your data applications more efficiently. You can check the detailed tutorials about billing, concepts, and the services given by aws cloudwatch here.
How DataBricks Integrate with CloudWatch

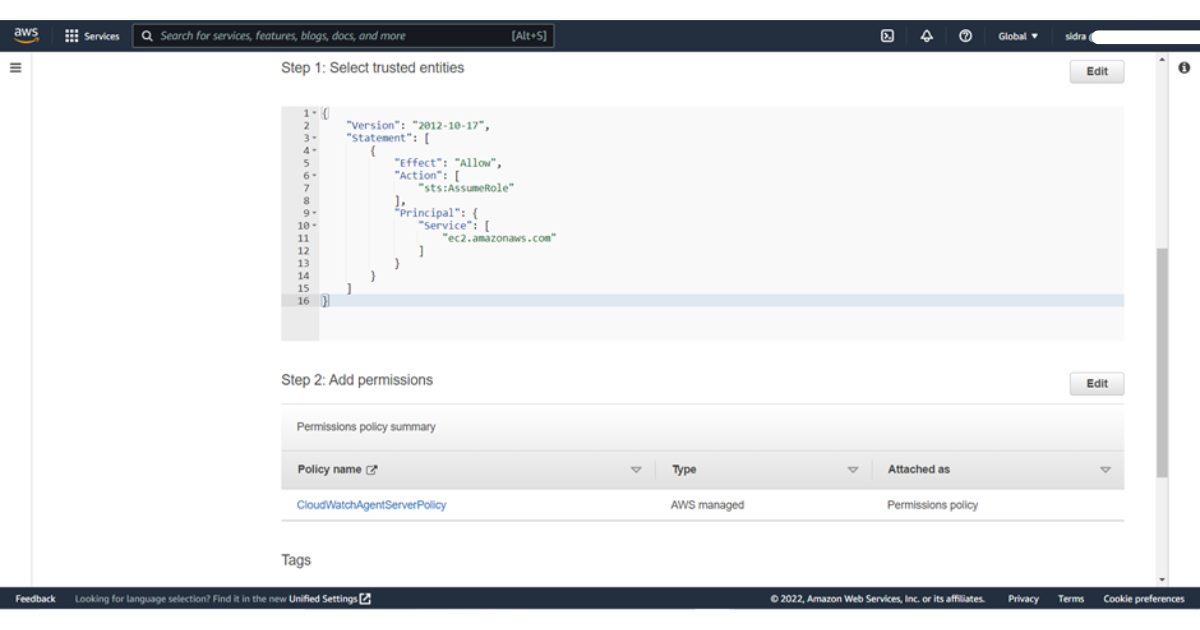
Step 1 : Create the IAM role
The first step is creating the IAM role that the CloudWatch agent uses to access data. These permissions allow the agent to read information from your instances and write it to CloudWatch. Next, you’ll need to attach the same IAM role to the EC2 instance that will be creating the CloudWatch agent configuration file. This role gives the server the permission to write to Parameter Store, in addition to the permissions that allow the instance to read information from the agent and write it to CloudWatch. This role includes permissions sufficient to run the CloudWatch agent as well as to write to Parameter Store.
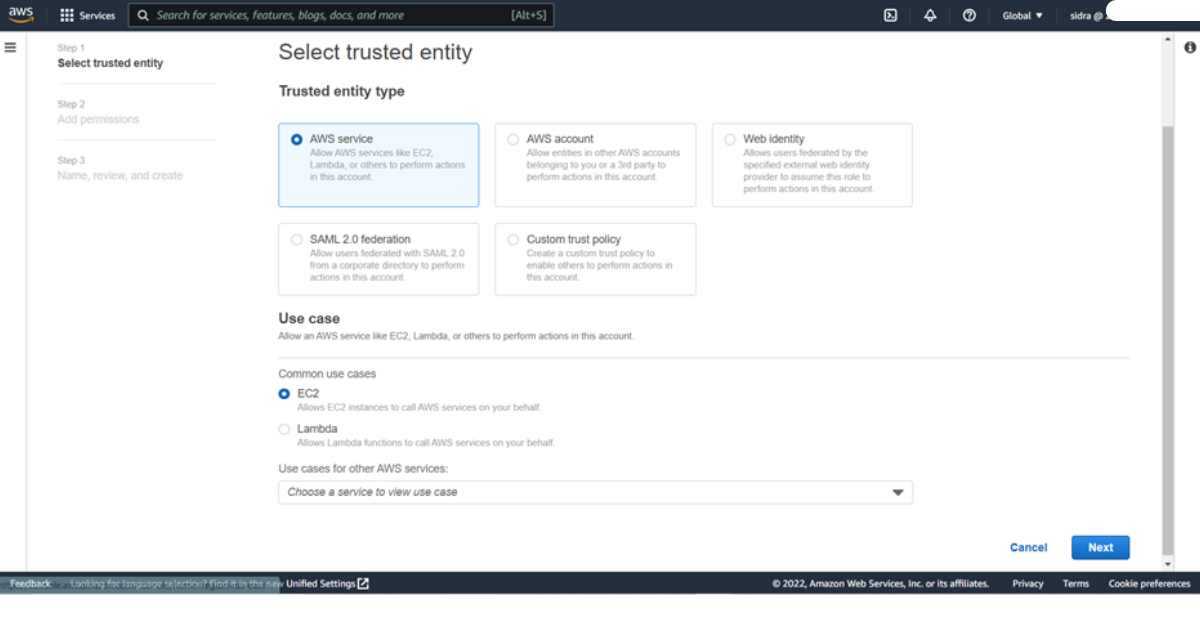
1) To create a new IAM role, sign in to the AWS Management Console at https://console.aws.amazon.com/iam/.
2) From the navigation bar, choose Roles, and then choose Create role.
3) Select EC2, and then choose Next: Permissions.
4) Under Common use cases, choose Systems Manager.
5) Under Services that manage the service, choose EC2.
Choose Next: Permissions.
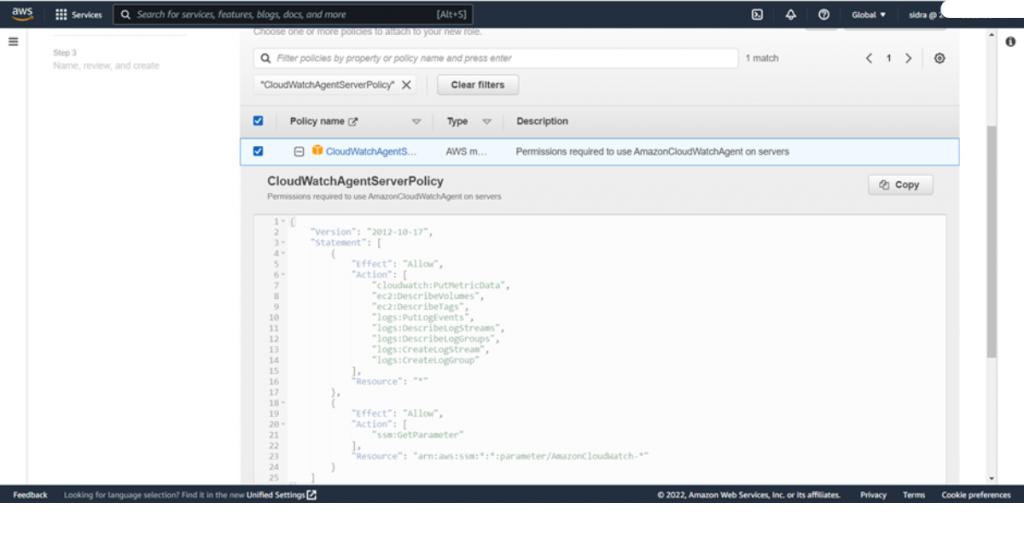
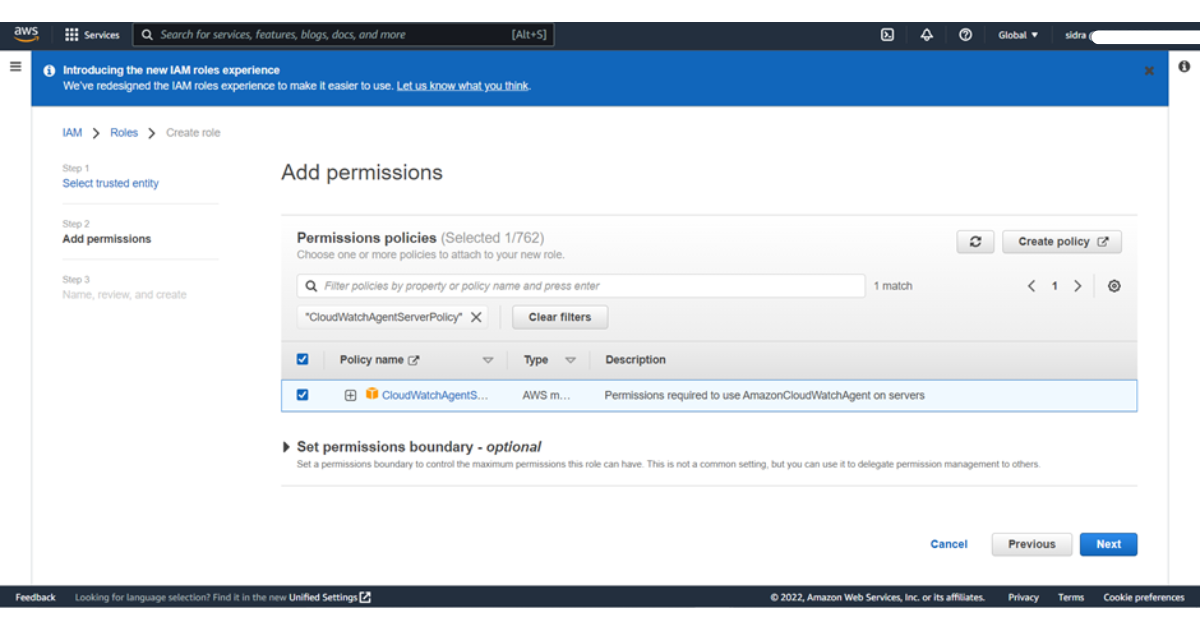
6) In the policies add the filter CloudWatchAgentServerPolicy and select it then press next
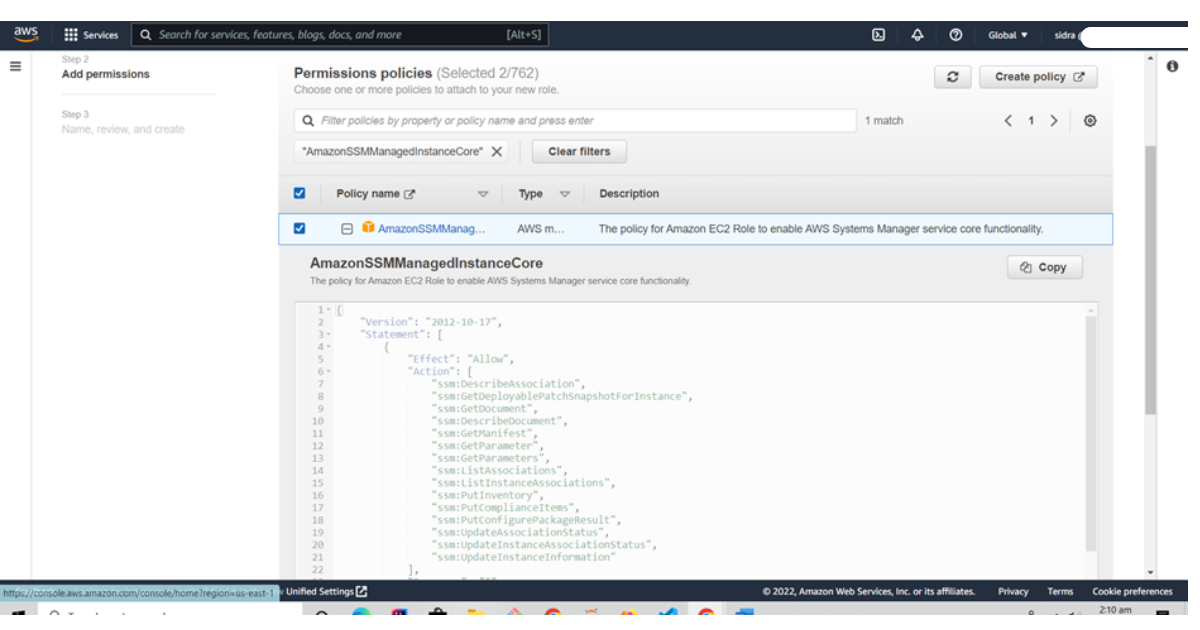
You’re ready to configure the systems manager service core function with the role created earlier.
Note: if you plan to run the CloudWatch agent only through the command line, you can skip the AmazonSSMManagedInstanceCore policy.
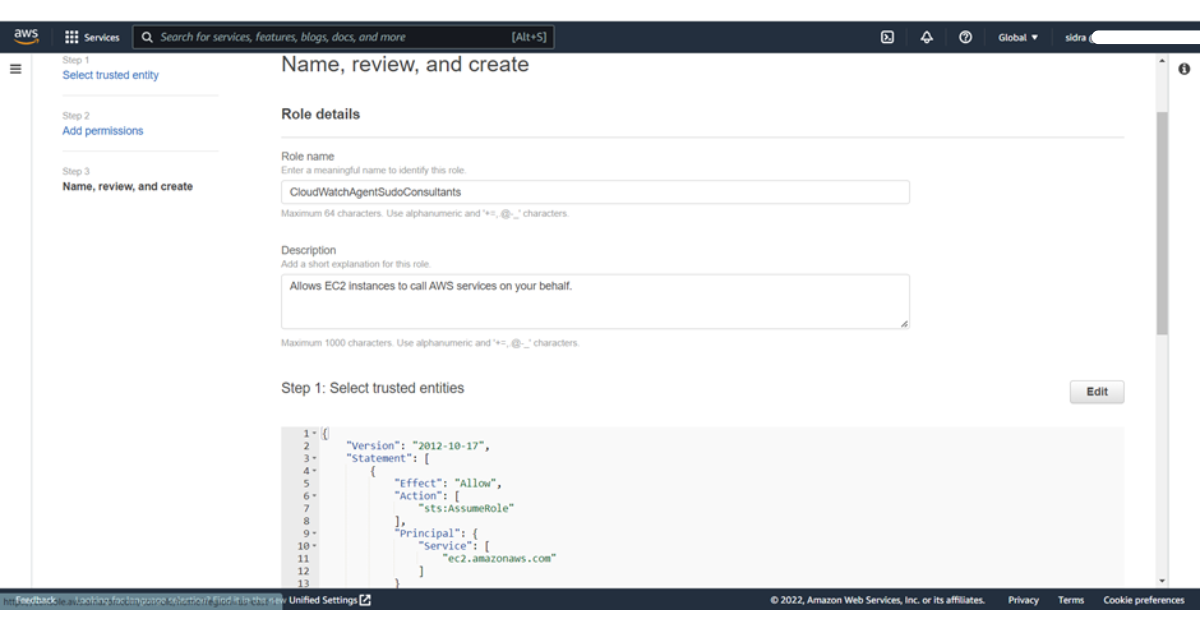
7) Enter Name: CloudWatchAgentServerRole or any name you want as we mentioned CloudWatchAgentSudoConsultants.
8) Enter Description: A description of the role.
9) Choose Next: Tags.
Enter the following:
Tag key = Type: Value pairs (a space is required between each pair)
Note: Entering Tags is optional
10) Choose to Create a role.
The role is now created.
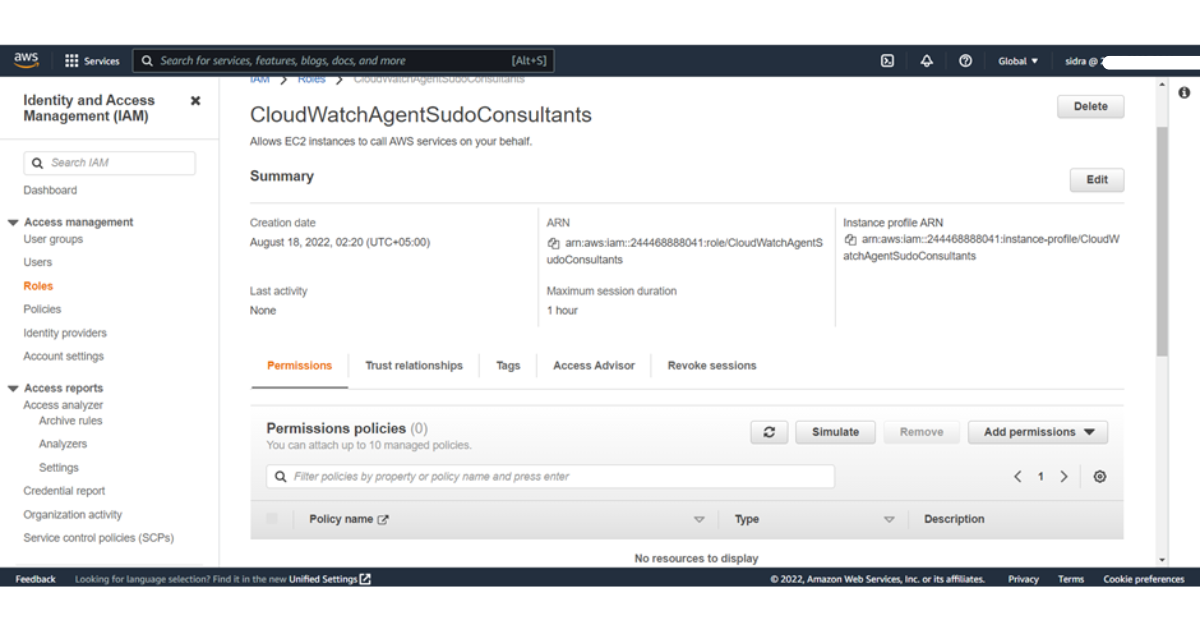
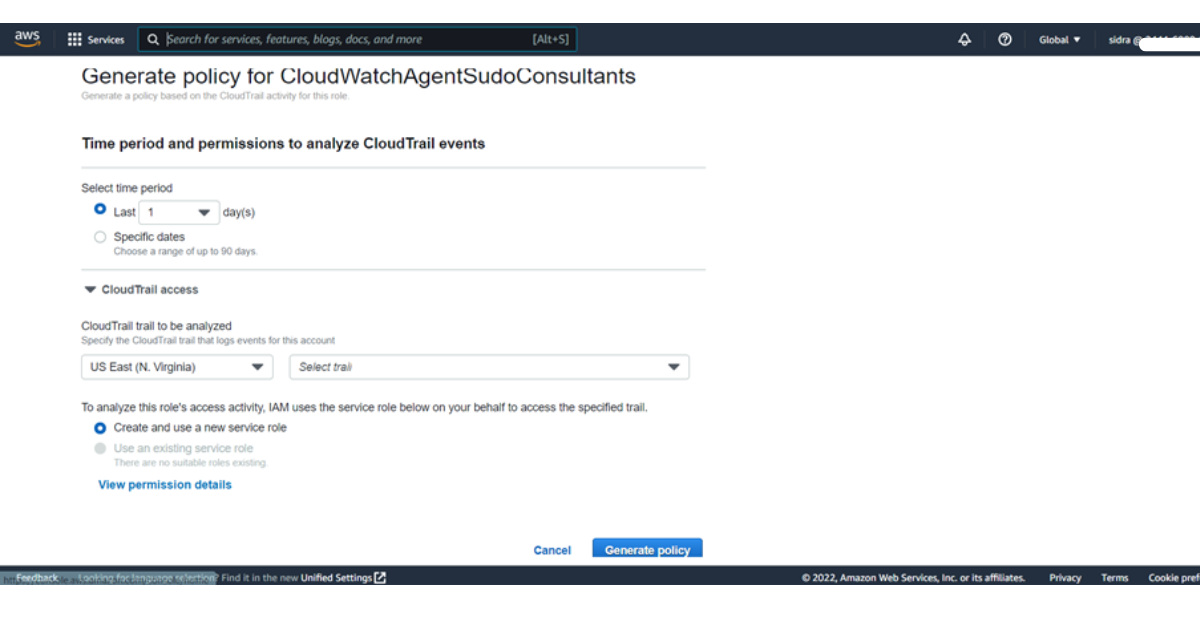
You can also generate policies
Don’t forget to check the estimated charges of gs monitor on cloudwatch here.
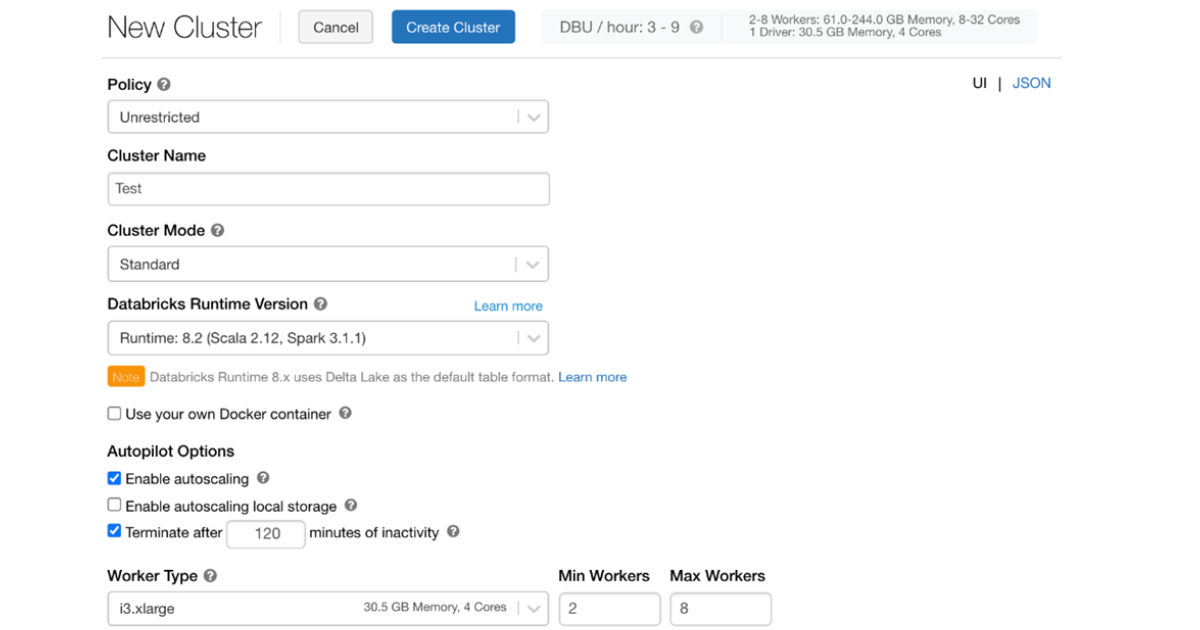
Step 2 ) Create a cluster in DataBricks
After clicking the create icon, you will arrive on the Create Cluster page. You can name the cluster and define the properties of the cluster. You can configure the name, the number of nodes in the cluster, and the storage type that the cluster uses. Do keep in mind the best practices while cluster configuration.
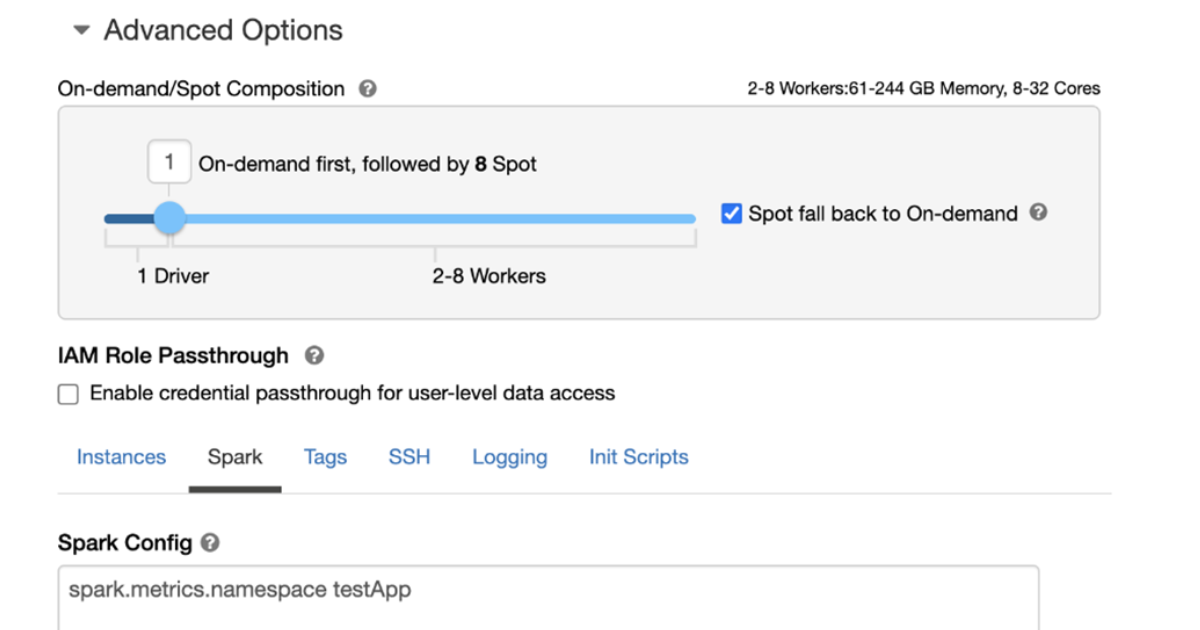
Step 3) Setting up On-demand and on-spot instances
Databricks supports creating clusters that use a combination of on-demand and spot instances, giving you the opportunity to create a cluster that suits your particular needs. This diagram shows a configuration that specifies that the driver node and 1 worker node should be launched as an on-demand instance, while the remaining worker nodes should be launched as on-spot instances, with the maximum spot price set to 100% of the on-demand price.
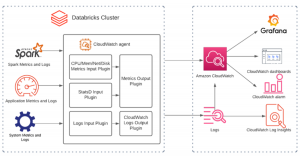
Step 4) Set the spark.application.id in the Spark application file metrics.namespace <app-name> so that the application-id won’t be prefixed to the metrics.
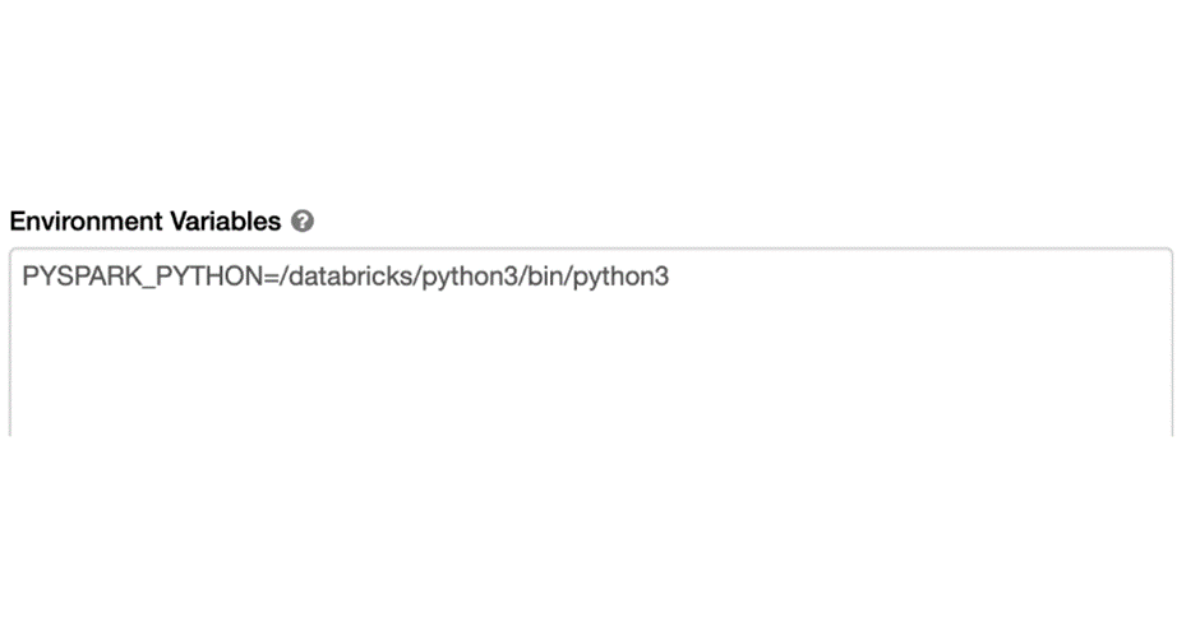
Step 5 ) Set Environment variables
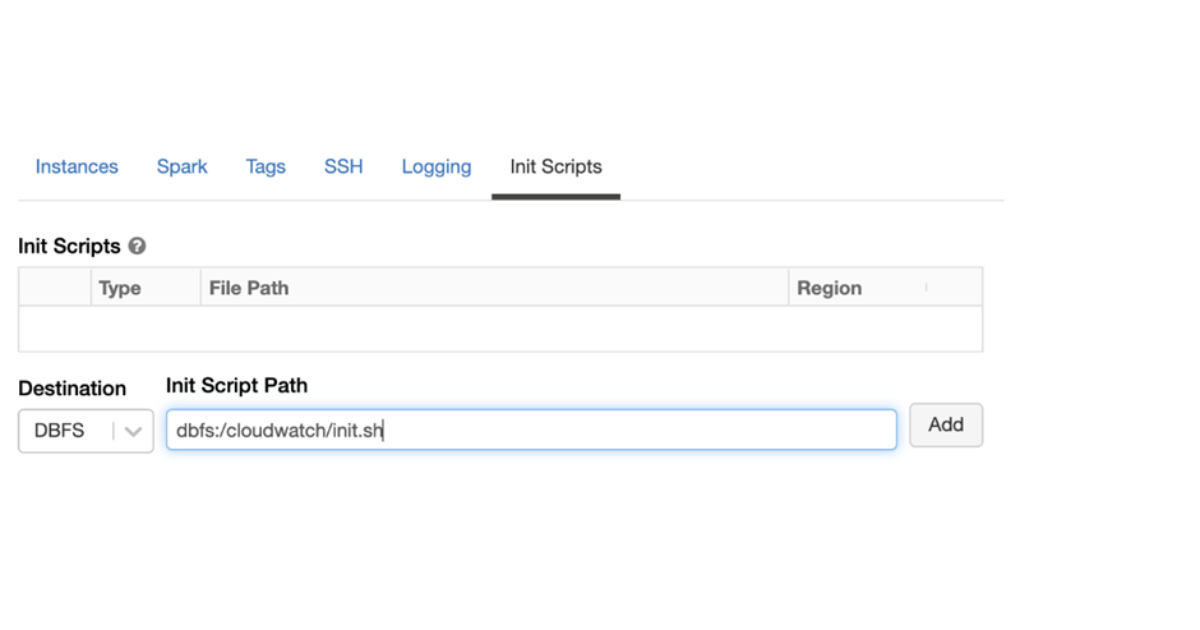
Step 8) To configure a cluster run an init script:
If the default init script isn’t located in the same directory as the init script you’re trying to run, enter the path to the default init script in the text box.
In the box that appears, type the name of the init script( Here cloudwatchinit.sh ) to be executed. By default, the destination type is DBFS. Launch the clusters with cloudwatchinit.sh file after adding the path of this file.
You can get detailed info about init scripts after reading this article.
- Run the given command to confirm if the agent is running properly:
%sh ps -ef |grep cloudwatch | grep agent
You can check further how to install cloudwatch agent on EC2 instance
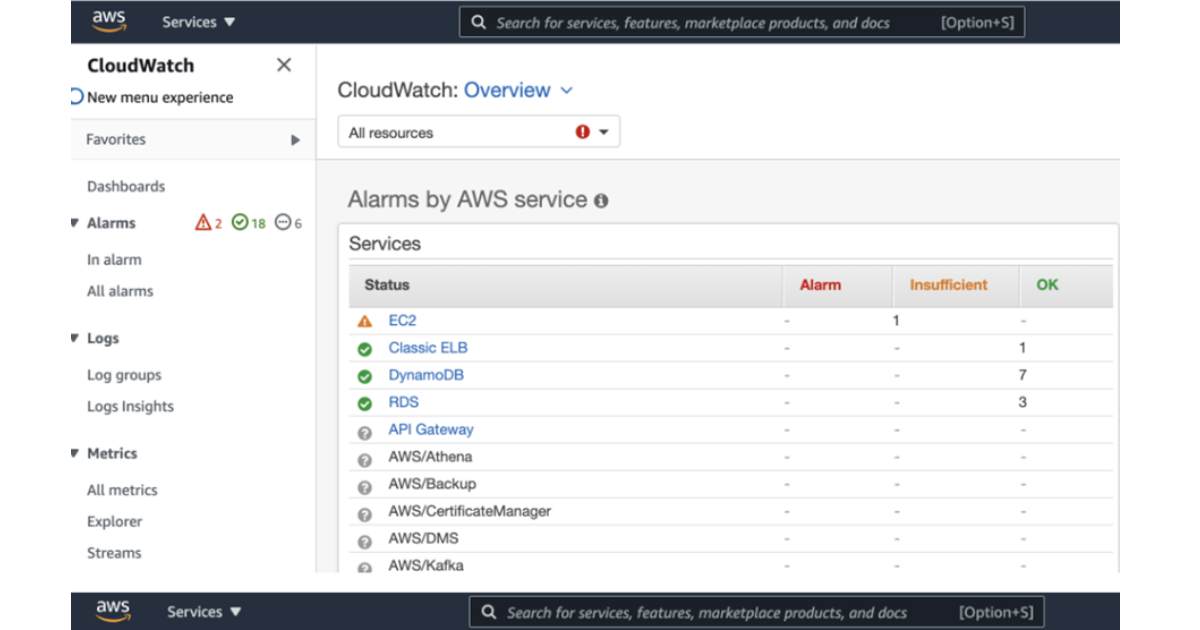
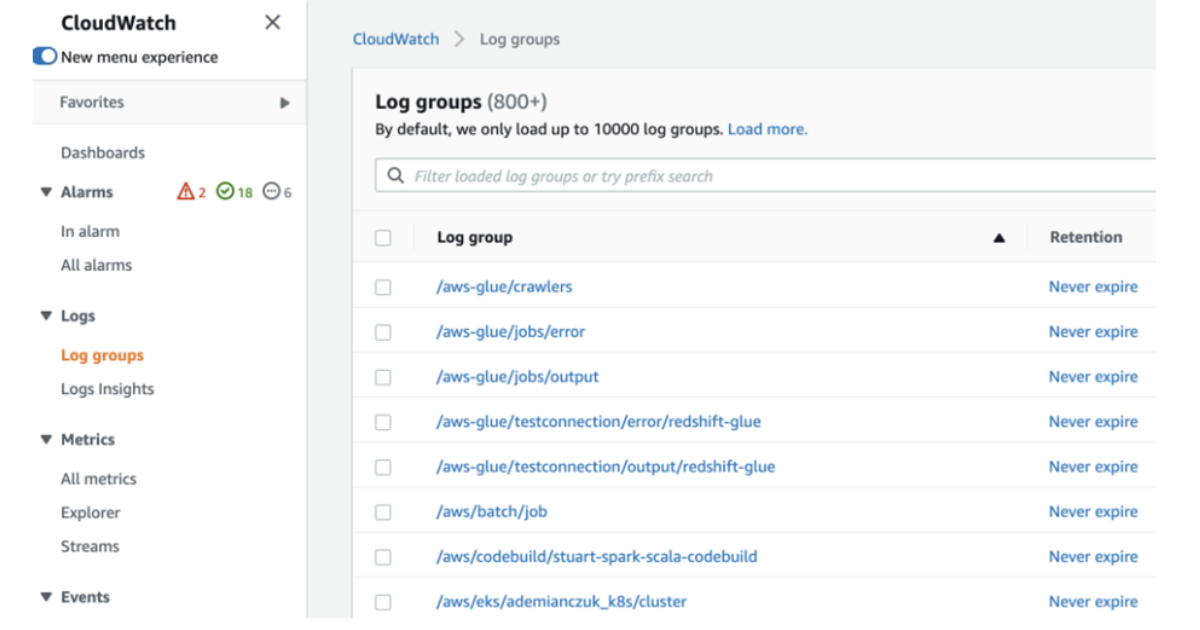
Following are some screenshots of Dashboard ,Alarms and logs etc in CloudWatch.
Here are the resources on github for demo setup of CloudWatch integration with DataBricks
Conclusion :
With the integration of DataBricks with AWS Monitoring service CloudWatch you can locate the problems before they impact your entire organization, if you use monitoring and alerting. These tools allow you to spot slow jobs or jobs that haven’t completed successfully, so that you can fix any issues that are causing these delays before they affect your data pipelines. Monitoring can also help you identify larger data sets or detect regional outages, so you can take action and prevent data loss.
A Software Engineer by profession and a Writer by passion