
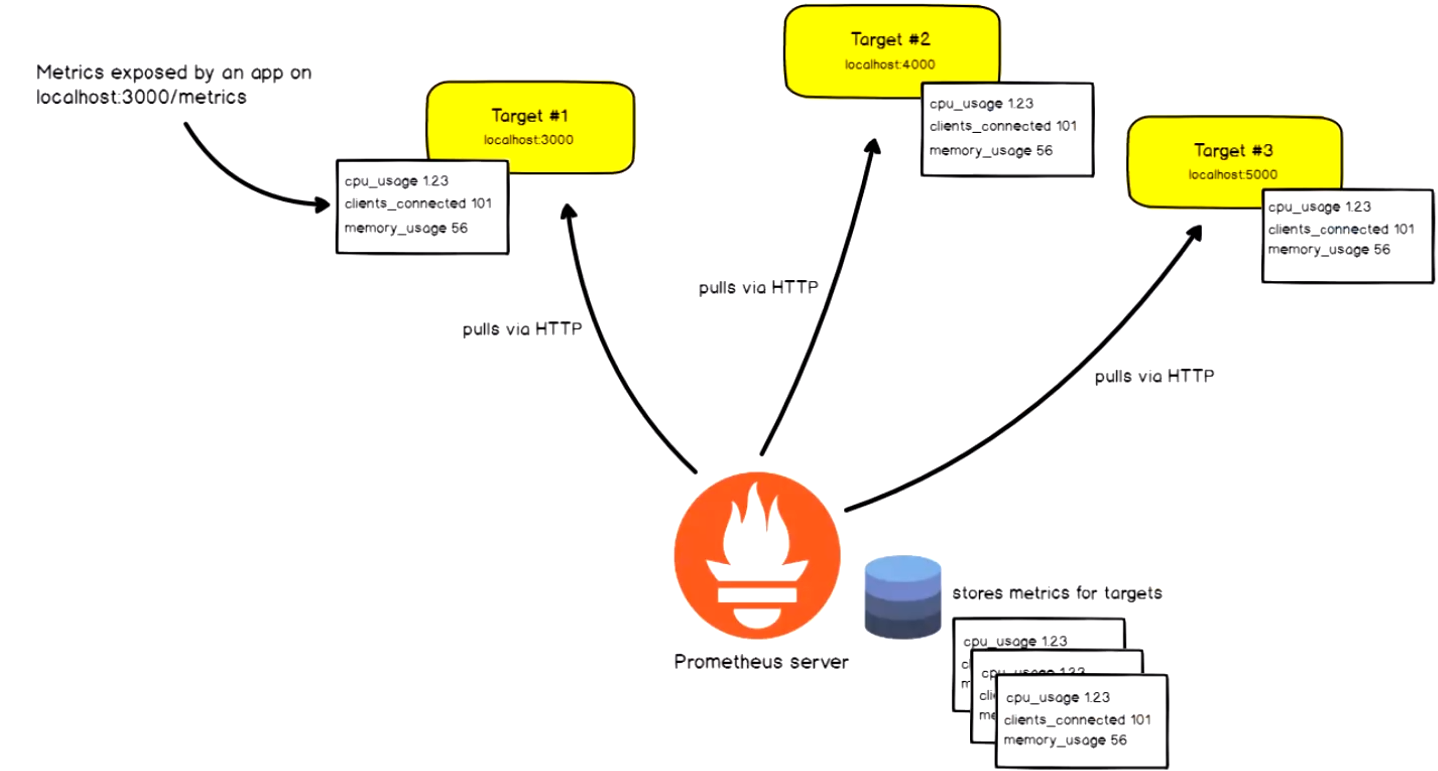
Prometheus is a monitoring application tool. That is, it primarily stores time series of numerical values. Each of these time series is identified by a combination of text-based labels, which causes it to filter through PromQL, the query language.
But, before we get into the features that have made Prometheus the de-facto monitoring standard, let’s talk about what Prometheus isn’t:
Prometheus is not a logging tool – It has no way of storing or parsing log lines. The timeseries values are strictly numerical.
Furthermore, Prometheus is not a tracing tool – Although you can instrument your code to expose Prometheus metrics, as we will see later, they are just that: metrics.
Last but not least, Prometheus is not a data lake – Prometheus, despite its great flexibility and power for gathering and indexing metrics, is not designed to store and serve millions of time series over months or years.
Now that we’ve established what Prometheus is and isn’t, let’s look at some of the features that have helped it become the most widely used monitoring tool in cloud native environments.
One of the most popular features is how simple it is to set up Prometheus in a Kubernetes cluster.
Furthermore, with some annotation in your pods (some of which come by default), Prometheus can automatically discover metrics and begin scraping them from the first minute. This autodiscovery extends beyond Kubernetes to platform-specific resources such as AWS, Azure, GCE, and others.
Another strength of Prometheus is the use of labels to describe time series rather than dot-separated metrics. The Prometheus approach makes metrics completely horizontal and adaptable, removing the constraints and hierarchy of the dot-separated architecture. However, one of the repercussions of the label-based metric model is the potential of cardinality explosion – a combination of labels that generates an enormous number of different metrics.
PromQL
The Prometheus query language makes it simple to begin filtering some labels (promQL). Prometheus includes a functional query language called PromQL that allows the user to pick and aggregate time series data in real time. An expression’s result can be displayed as a graph, viewed as tabular data via Prometheus’s expression browser, or ingested by external systems via the HTTP API.
An expression’s result can be displayed as a graph, viewed as tabular data via Prometheus’s expression browser, or ingested by external systems via the HTTP API. In other circumstances, you may need to develop aggregations to total the values of all metrics with a specific label, or you may begin to use simple mathematical expressions with different metrics to generate your own indicators and rates.
With enough practice, you will be able to construct complicated searches by folding and aggregating metrics to extract the information you require. That is the power of the PromQL language, and it is also one of the reasons why Prometheus became so famous.
However, you may utilize the PromQL language to provide not only data visualization but also alerts. Prometheus allows you to construct rules for alerting purposes. These notifications have full PromQL power. You can compare different metrics by setting rate thresholds between different values, numerous conditions, and so on. The flexibility it provides is one of the factors that enables the SRE team to fine-tune the alerts to reach that sweet spot of alerting when it is truly needed, avoiding false positive alerts while covering all potentially hazardous circumstances.
Installing Prometheus
Prometheus can be installed in a variety of ways on your host or in your Kubernetes cluster:
Directly on your hosts as a single binary, which is good for learning, testing, and development but not suitable for containerized deployment.
As a Docker container with multiple orchestration options:
Raw Docker containers, Kubernetes Deployments/StatefulSets, the Helm Kubernetes package manager, Kubernetes operators, etc
You can download and run the Prometheus binary directly from your host:
<pre>prometheus-2.21.0.linux-amd64$ ./prometheus ./prometheus level=info ts=2022-08-25T10:04:24.911Z caller=main.go:310 msg=”No time or size retention was set so using the default time retention” duration=15d
[…]
level=info ts=2022-08-25T10:04:24.916Z caller=main.go:673 msg=”Server is ready to receive web requests.”</pre>
This could be useful for getting an initial view of the Prometheus web interface (port 9090 by default). However, deploying the Prometheus server inside a container is a superior option:
<pre>docker run -p 9090:9090 -v /tmp/prometheus.yml:/etc/prometheus/ prometheus.yml prom/prometheus</pre>
The Prometheus community maintains a Helm chart that makes it extremely simple to install and configure Prometheus and the ecosystem’s various applications. Simply run the following commands to install Prometheus on your Kubernetes cluster:
Add the Prometheus charts repository to your helm configuration:
<pre>helm repo add prometheus-community https://prometheus-community.
github.io/ helm-charts helm repo add stable https://kubernetes-charts.storage.googleapis.com/helm repo update</pre>
Install Prometheus:
<pre># Helm 3
helm install [RELEASE_NAME] prometheus-community/prometheus
# Helm 2
helm install --name [RELEASE_NAME] prometheus-community/prometheus</pre>
After a few seconds, you should see the Prometheus pods in your cluster.
Helm chart deploys node-exporter, kube-state-metrics, and alertmanager with Prometheus, allowing you to begin monitoring nodes and cluster state immediately. The Prometheus operator, which will be covered in great detail on the SUDO blog in the future, is a more advanced and automated solution. Consider it a meta-deployment, or a deployment that manages other deployments, configuring and updating them in accordance with high-level service criteria.